

More on Beijing's Airenaissance: When The Air’s Bad, and When It’s Good
[Update June 8] Updating this as a friend pointed out that I made a critical error in equating the US Embassy PM 2.5 data, which is reported in µg/m³, with AQI, which is an entirely different indicator calculated using several measures, including PM 2.5 per µg/m³. All of my charts refer to PM 2.5 in µg/m³, but these points are not AQI figures -- you can convert PM 2.5 figures to AQI with this calculator here (and read more about AQI in general here).
Hence my inital statement below (that I have since corrected and bolded below) "This puts Beijing's average air quality in the upper end of 'Moderate' (51-100) as defined here" is entirely wrong -- using the AQI calculator, an average PM 2.5 concentration of 98 is equivalent to AQI 173, or in the Unhealthy range.
My apologies for the error and the charts are now recast into equivalent AQI figures in the comments.
---
Since 2008 the US Embassy near Liangmaqiao has been recording PM 2.5 on site on an hourly basis, a fact that many of us already know and appreciate here in Beijing.
However, did you know that all of their historic data is openly available for download, allowing all sorts of nerdy calculations?
I didn’t, that is until I stumbled onto it yesterday in order to independently verify my own observations and the city government’s proclamation that the air in Beijing this year has been significantly better than last.
Rather than pontificate via text here, I’m going to let my crude Excel charts do the talking. But for those of you who don’t want to scroll down past the infinite number of disclaimers I am required to post, here’s a quick summary of my unofficial findings from my amateur data-crunching:
1. The air has indeed been better over the first four months of 2015 than over the same periods in 2014, 2013, and 2012. However, 2015 is still worse than the same periods of 2011, 2010, and 2009.
2. The air is best from noon to 4pm, and worst from 8pm to 2am. Action points: Don’t exercise outdoors after work at night. Instead do it over lunch hour or the early morning. Also, keep your windows closed and air filters on overnight.
3. The air is best on Mondays, and gradually gets worse over the week, with Saturday being the worst. My speculation is that the M-F buildup may have something do to with weekday industrial production, and Saturday’s peak may have to do with the fact that cars are unrestricted on the weekends.
4. The winter months are worse than the spring and summer, with April-May and August-September being the best, and January and February bringing up the rear. Coal burning for heat must have something to do with this.
5. The first half of the month tends to be better than the second half, by a smidgen. This could be due to the fact that people get busier as the month goes on, or factories go on double-time to meet end-of-the-month quotas.
So looking to plan your next outdoor event and want to maximize your chances of good air? Then plan it for the first Monday of the month from noon to 4pm in May or August.
Now, for the disclaimers, which the US State Department requires anyone using the data to present:
* This is unofficial data.
* I am not a statistician and I have not done any statistical significance tests on the differences I've calculated.
* The air is still pretty bad all the time in Beijing, averaging 98 over the entire 5-year range of 60,000+ data points. This is the equivalent of an AQI rating of 173, which is in the middle of the "Unhealthy" range (151 to 200). This category has toe following warning associated with it: "Everyone may begin to experience health effects; members of sensitive groups may experience more serious health effects."
* The US Embassy data collector is a single-point data collector that only collects samples in the immediate area of the embassy. The air can vary incredibly over short distances, so this is not an accurate measure of all the air in Beijing. However it is worth noting that the values and the trends that the embassy reports are generally in line with Beijing city government data, so the embassy data can be looked at as a rough proxy for overall air quality.
* The US Embassy data collector is frequently offline and has occasionally gone “beyond index,” which leaves gaps in the data that I have not tried to account for; rather I have just omitted them in calculating averages.
* I’ve made no attempt to factor in holidays, the Olympics period, the APEC period, or the various introductions and suspensions of the odds-evens plate policy, all of which affect air quality readings.
* PM 2.5 isn't all that we need to worry about in terms of pollution. There's PM 10, nitrogen dioxide, sulfur dioxide and ozone to be concerned with as well, but the embassy does not measure or report figures for these.
* I have included the full US State Department disclaimer below* for those of you who love reading disclaimers.
Now onto the charts:

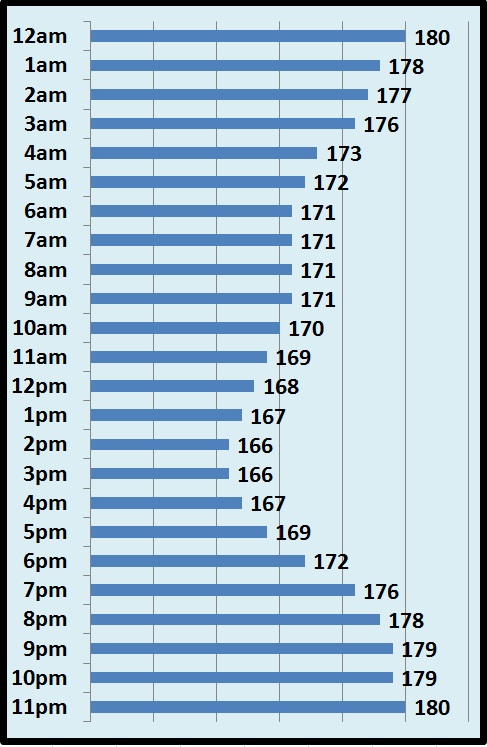
By the hour: Here's the average reading by hour of Beijing's PM 2.5 density in µg/m³, where we can see that the air is roughly 23 percent better in the afternoon at 2pm and 3pm (85) than the dark of night, where it peaks at the 11pm and 12am hours (111).
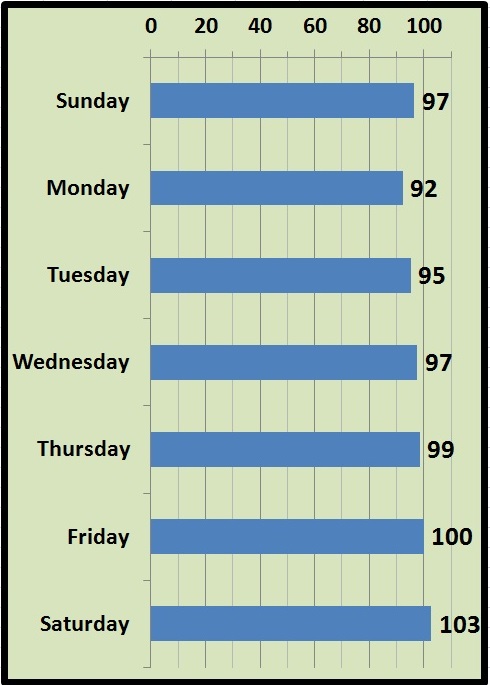
By the day of week: Here's the average PM 2.5 density in µg/m³ by day of week, where we can see that the air is roughly 11% better on Mondays (92, the best day of the week on average) then on Saturdays, when it averages 103.
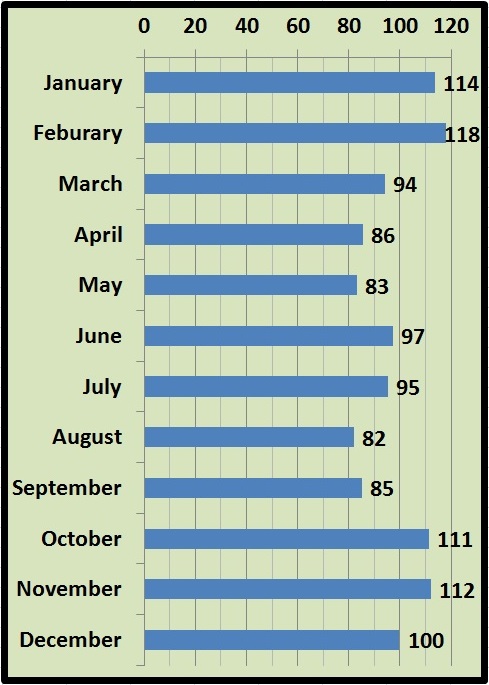
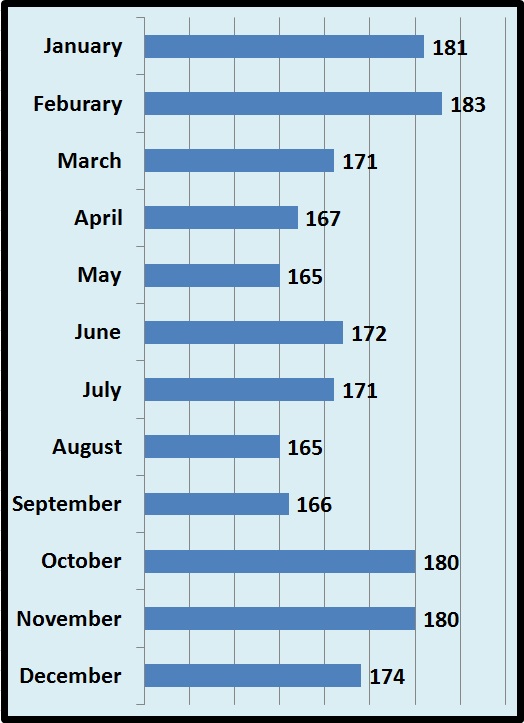
By the month: Here's the average PM 2.5 density in µg/m³ by month, where we can see that the air is roughly 30 percent better in delightful August (82) than in hideous February (118).
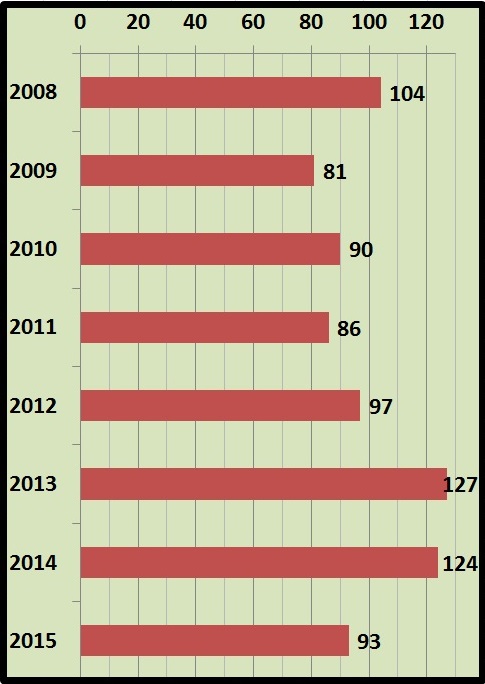
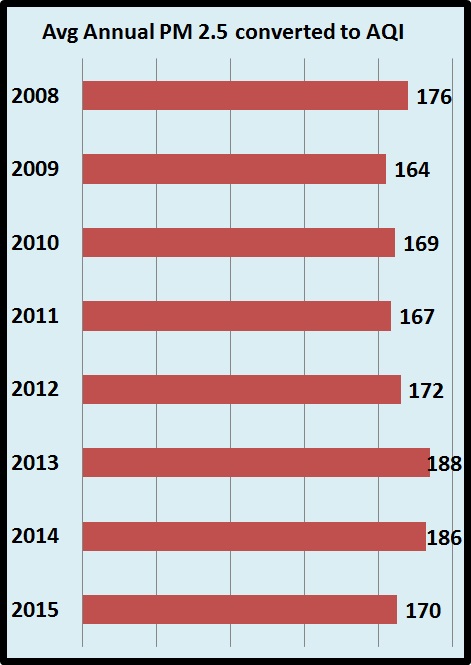
By the year: This chart of PM 2.5 density in µg/m³ is only for the January through April periods, demonstrating that 2015 has in deed been markedly better than last year (25 percent better to be exact), and 27 percent better than 2013. However, this year has been 15 percent worse than 2009 (so far).
And now for the full disclaimer on the data from the US Department of State:
*The US Department of State Data Use Statement applies to data available from the Mission China air quality monitoring program, which includes the data portal www.stateair.net. The purpose of these guidelines is to make all interested parties aware of the nature and objective of the data.
• State Air observational data are not fully verified or validated; these data are subject to change, error, and correction. The data and information are in no way official.
• If observational data are used for analyses, displayed on web pages, or used for other programs or products, the analysis results, displays, or products must indicate that these data are not fully verified or validated.
• Only validated data should be used for reports and data analysis whenever possible.
• Air quality data should not be altered in any way and should be disseminated as received. Air quality data should be displayed in accordance with the Air Quality Index (AQI) and corresponding Red Green Blue (RGB) colors as directed in the Guideline for Reporting of Daily Air Quality-Air Quality Index (AQI) www.epa.gov/ttn/oarpg/t1/memoranda/rg701.pdf.
• Publications, analyses, products, presentations, and/or derived information that rely on these data must give attribution to the US Department of State.
• Data and information reported by State Air are provided for the express purpose of providing US citizens living and traveling abroad actionable health information related to air pollution.
By accessing this data you attest to having read, understood, and agreed to the data use conditions stated above.
Images: the Beijinger
Related stories :


Comments
New comments are displayed first.Comments
 rstcyrmd
Submitted by Guest on Mon, 06/08/2015 - 13:48 Permalink
rstcyrmd
Submitted by Guest on Mon, 06/08/2015 - 13:48 Permalink
Re: More on Beijing's Airenaissance: When The Air’s Bad, and...
Awesome data, Michael, my kind of number crunching. I actually didn't realize pollution was best in mid-afternoons... May also was another much better than usual month. I don't care if it's wind or real changes -- it's nice to see cleaner skies here. My cutoff of wearing a mask outside is 200, there have been a lot fewer of those days this year.
 admin
Submitted by Guest on Mon, 06/08/2015 - 13:41 Permalink
admin
Submitted by Guest on Mon, 06/08/2015 - 13:41 Permalink
Re: More on Beijing's Airenaissance: When The Air’s Bad, and...
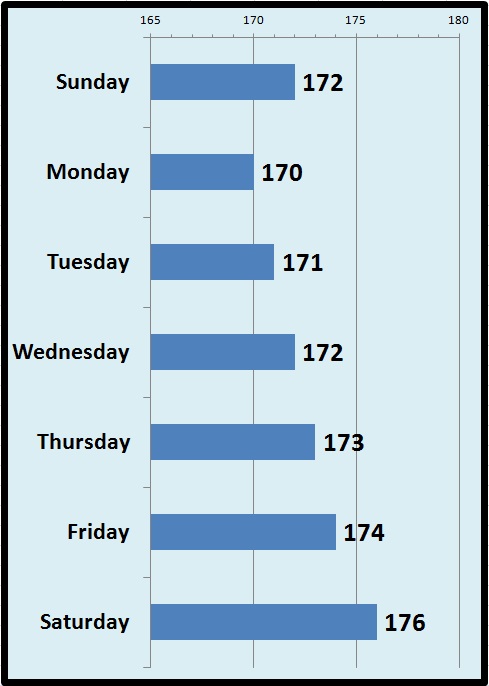
Here is the by day of week chart converted to AQI from the PM 2.5 density in µg/m³:
admin
Submitted by Guest on Mon, 06/08/2015 - 13:38 Permalink
Re: More on Beijing's Airenaissance: When The Air’s Bad, and...
Here is the by the month chart converted to AQI from the PM 2.5 density in µg/m³:
admin
Submitted by Guest on Mon, 06/08/2015 - 13:26 Permalink
Re: More on Beijing's Airenaissance: When The Air’s Bad, and...
The rather depressing thing is that in order to fall into the "Good" AQI zone on the US government's AirNow calculator, the PM 2.5 density in µg/m³ would have to be 12 or under. Yes, that's 12.
Looking back at the data the US embasssy collected, the PM 2.5 density in µg/m³ has been 12 or under for 4,272 hours of the 56,188 recoreded, or 8% of all the readings.
admin
Submitted by Guest on Mon, 06/08/2015 - 12:40 Permalink
Re: More on Beijing's Airenaissance: When The Air’s Bad, and...
Here is the by the hour chart converted to AQI from the PM 2.5 density in µg/m³:
admin
Submitted by Guest on Mon, 06/08/2015 - 09:15 Permalink
Re: More on Beijing's Airenaissance: When The Air’s Bad, and...
Here is the first chart converted to AQI figures. Note:
It's important to note that AQI is a measure of multiple pollutants, not just PM 2.5, and these figures are converted from PM 2.5 alone.
The AQI index takes into account that day's worst pollution source, so for instance, if PM 10 or Nitrogen Dioxide was the primary pollutant during the measured period, the AQI index could be even higher.
Therefore it would be correct to assume these figures represent the lowest possible AQI for these periods
Validate your mobile phone number to post comments.