

Only 15 More Years Before Beijing Has Clean Air
New government targets for PM2.5 reduction were announced yesterday, and if that pattern holds, Beijing could achieve the World Health Organization's suggested limits of 25 micrograms per cubic meter of air ... sometime around 2030.
Lest we be accused of looking at the glass as half empty, the good news is that the new targets not only include Beijing but also Tianjin and the particularly filthy province of Hebei, which virtually surrounds the capital (and home to seven of the top 10 worst polluted cities in China).
The new limits have the three-headed megalopolis attempting to limit PM2.5 to 73 micrograms per cubic meter by 2017 and 64 micrograms per cubic meter by 2020.
Also, the new targets actually show that the target date to WHO-standard air has actually gotten a dozen years closer – the last time we did the math, at the beginning of 2015, our estimate was that it would be 2043 before Beijing's air met international standards.
Truth be told, we're just using some simple Excel forward forecasting techniques that woud not stand up to scientific or mathematical rigor. But it does give you a sense of the scale of the issue and how long it will take to solve (and why you need to start protecting yourself now rather than waiting for things to get better). On the flip side, it also shows that despite those nasty days we've experienced lately, the trend is headed in the right direction.
The average annual concentration of PM2.5 in Beijing in 2014 was 85.9 micrograms per cubic meter, 4 percent lower than 2013's grim 89.5. While 2015 figures will not be available until the year is done and the number crunchers have worked their magic, using official AQI figures through yesterday as a proxy (and no, AQI is not the same thing), the air seems to have been about 2.7 percent cleaner in 2015, implying the PM2.5 average over 2015 could end up in the low 80s.
When factoring in Hebei and Tianjin, the region's air was worse – according to the Global Times, the average PM2.5 level over the whole region in 2013 was 106 micrograms per cubic meter, significantly worse than Beijing itself (89.5). That could mean that when analyzed alone, the city of Beijing could potentially meet the WHO standard even earlier than we're projecting.

When talking pollution, it's much more than just local sources that cause us in Beijing trouble, and this is why having Tianjin and Hebei join in the fun is such welcome news. Hebei is one of Planet Earth's major steel making centers, most of it fueled by burning coal.
And lest you become complacent regarding the health effects of PM2.5 pollution, let us grimly remind you of what the WHO has to say on the matter (emphasis ours): "Small particulate pollution have health impacts even at very low concentrations – indeed no threshold has been identified below which no damage to health is observed. Therefore, the WHO 2005 guideline limits aimed to achieve the lowest concentrations of PM possible."
Ten years on and that fact remains just a sobering now as it did then and is something to keep in mind as we move into the new year.
Image: the Beijinger
Related stories :


Comments
New comments are displayed first.Comments
 admin
Submitted by Guest on Fri, 01/08/2016 - 14:11 Permalink
admin
Submitted by Guest on Fri, 01/08/2016 - 14:11 Permalink
Re: Only 15 More Years Before Beijing Has Clean Air
some cool graphs i found at the Beijing Ministry of Environmental Protection here
1998-2015 pollution trends in Beijing for four major pollutants:
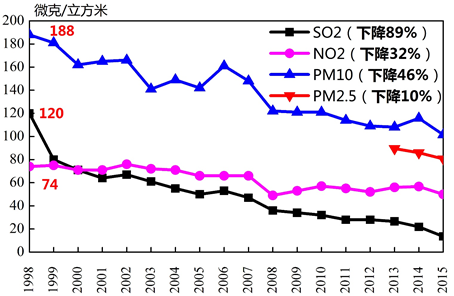
The blue line is PM10, which has been tracked regularly since 1998 and has seen significant declines over that period (46%). I ballparked the actual values and came up with a slope of that decline, which was generally a numerical decline of 3.9 um/m3 per year.
I applied that rate of decline to the PM2.5 (tracked for three years, in red above) and forecasted that should the PM 2.5 decline at a similar rate, it will be ~18 years (2033-2034) until we hit a concentration of ~10 um/m3 (the WHO standard).
2015 PM 2.5 concentrations by district
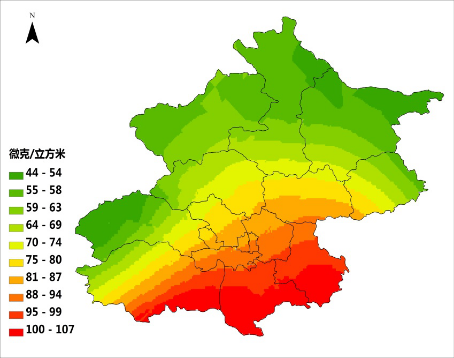
I will annotate this later, but as you can see, generally the farther north you go, the better the air gets.
Chaoyang District is sliced by two bands (88-94 basically south of the airport expressway) and (81-87 north of the airport expressway), which means the air is approximately 8% better in the northern half.
Shunyi is also bascially split in two, with residents in the southern half (aka the expat villa area within the 6th Ring Road) having the same air quality as northern Chaoyang (aka 81-87). Out beyond the 6th Ring the quality improves to the 75-80 band, which is another 8% improvement over northern Chaoyang (or a 15% improvement over south Chaoyang).
However, to really make a difference (say, 33% less or more), you'd have to go way, way out, fairly impractical for the average expat.
admin
Submitted by Guest on Tue, 01/05/2016 - 15:15 Permalink
Re: Only 15 More Years Before Beijing Has Clean Air
HI Michael, I see a common error here: for annual PM2.5, the WHO recommends 10 ug/m3, not 25. 25 is only for the 24-hour average...
I'm still digging into this to find out what the differences are between these two standards.
It's worth noting (health effects aside) that the recommendations are apparently nationwide averages, vs city averages.
The pollution I'm sure is bad for you nonetheless, but using the WHO's 10 ug/m3 standard, 1,121 of 1,617 world cities (or 69%) fail to meet this criteria, including cities such as:
Johannesburg
Montréal
Hilo, Hawaii
New York City
Napa, California
Buenos Aires
Rio de Janeiro
Kingston, Jamaica
Salzburg
Brussels
Berlin
Amsterdam
Barcelona
London
Phuket
Christchurch
Cebu
 rstcyrmd
Submitted by Guest on Tue, 01/05/2016 - 09:26 Permalink
rstcyrmd
Submitted by Guest on Tue, 01/05/2016 - 09:26 Permalink
Re: Only 15 More Years Before Beijing Has Clean Air
"Long-term" usually in the research means 6+ years exposure, that's what most of those big studies measured (Harvard Six Cities and others) so technically that's the best data that people can confidently mention. But they use those same studies to extrapolate and say things like "every ___ increase in PM2.5 leads to annual increase of ___ in mortality/heart disease/etc"... "Short term" literally can mean a few hours to a few days, especially heart disease and heart attack spikes with spikes in pollution.
rstcyrmd
Submitted by Guest on Fri, 01/01/2016 - 14:49 Permalink
Re: Only 15 More Years Before Beijing Has Clean Air
The main issue regards health effects from short term versus long term. FYI the WHO air quality guidelines are here, an easy read. For me, I'm most concerned about long term health effects, as the data clearly shows more mortality after long-term exposure to any PM2.5 above 10 -- far lower than the 25 used for daily exposure. Short term pollution spikes are more harmful to people who are already sick, putting them at higher risk. But overall, I'm much more concerned about the long-term exposure.
admin
Submitted by Guest on Fri, 01/01/2016 - 04:46 Permalink
Re: Only 15 More Years Before Beijing Has Clean Air
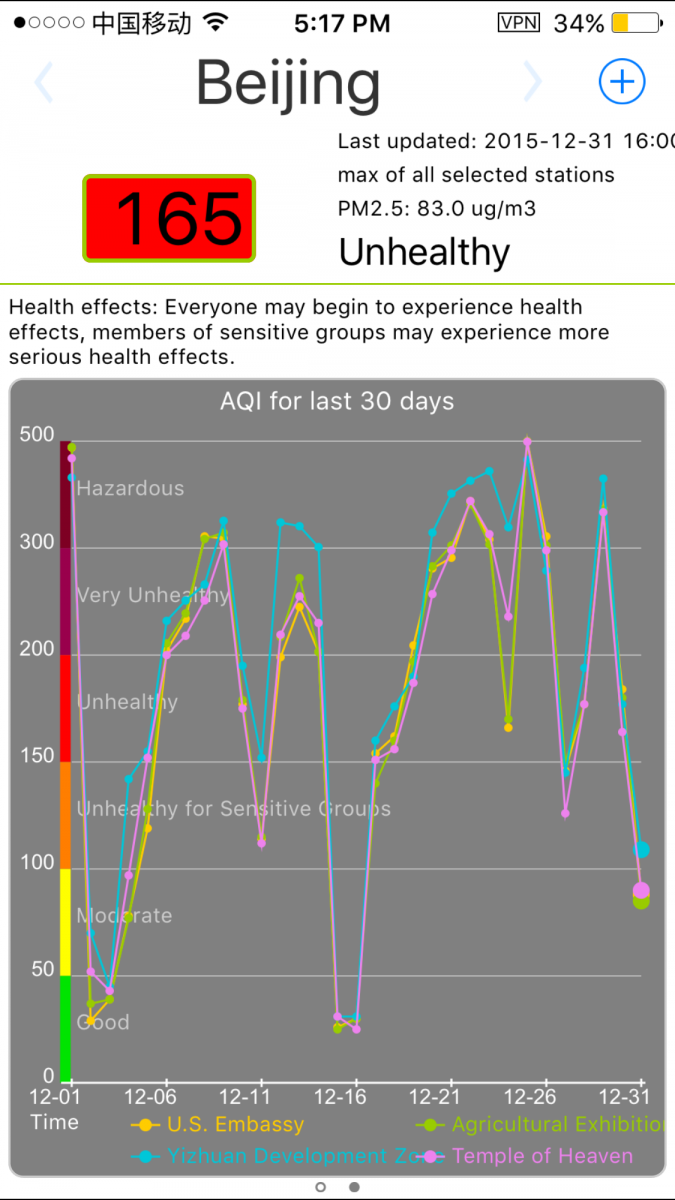
Are we really believing that Beijing's average PM2.5 has been ~90? We have had straight weeks of 200+ and multiple days in a row above 400. Summer time was often around 100 so, I'm not convinced we're coming down from 89.5 in 2013.
December has been an outlier -- the air has been extremely bad (most of november too) but if you go back to the rest of 2015, its been a better year om average.
If you believe us embassy monitor is "telling the truth" you will also need to conclude the Beijing government is too, as local government monitors are generally in line with US embassy readings (see the attached figures for the us embassy monitor in orange, compared to three government stations for the last 30 days)
admin
Submitted by Guest on Fri, 01/01/2016 - 04:36 Permalink
Re: Only 15 More Years Before Beijing Has Clean Air
HI Michael, I see a common error here: for annual PM2.5, the WHO recommends 10 ug/m3, not 25. 25 is only for the 24-hour average...
Thanks for pointing that out. From the WHO page:
PM2.5
10 μg/m3 annual mean
25 μg/m3 24-hour mean
I am a bit confused on how to interpret this: it seems that it is saying that the average annual mean should not exceed 10, while (any one?) 24 hour period should not exceed 25 ... Which doesn't seem to go together.
Lets say in a theoretical city the 24-hour mean every day for 365 days of the year is 20.
would that city not meet WHO's criteria in the 24-hour mean yet not in the annual mean? Seems odd to me
rstcyrmd
Submitted by Guest on Thu, 12/31/2015 - 20:20 Permalink
Re: Only 15 More Years Before Beijing Has Clean Air
HI Michael, I see a common error here: for annual PM2.5, the WHO recommends 10 ug/m3, not 25. 25 is only for the 24-hour average...
Validate your mobile phone number to post comments.